Read your Stats
Stats shows where your money went and how much of it stayed with you: month by month on a chart, by category in a ring, and as a total for each of your months.
-
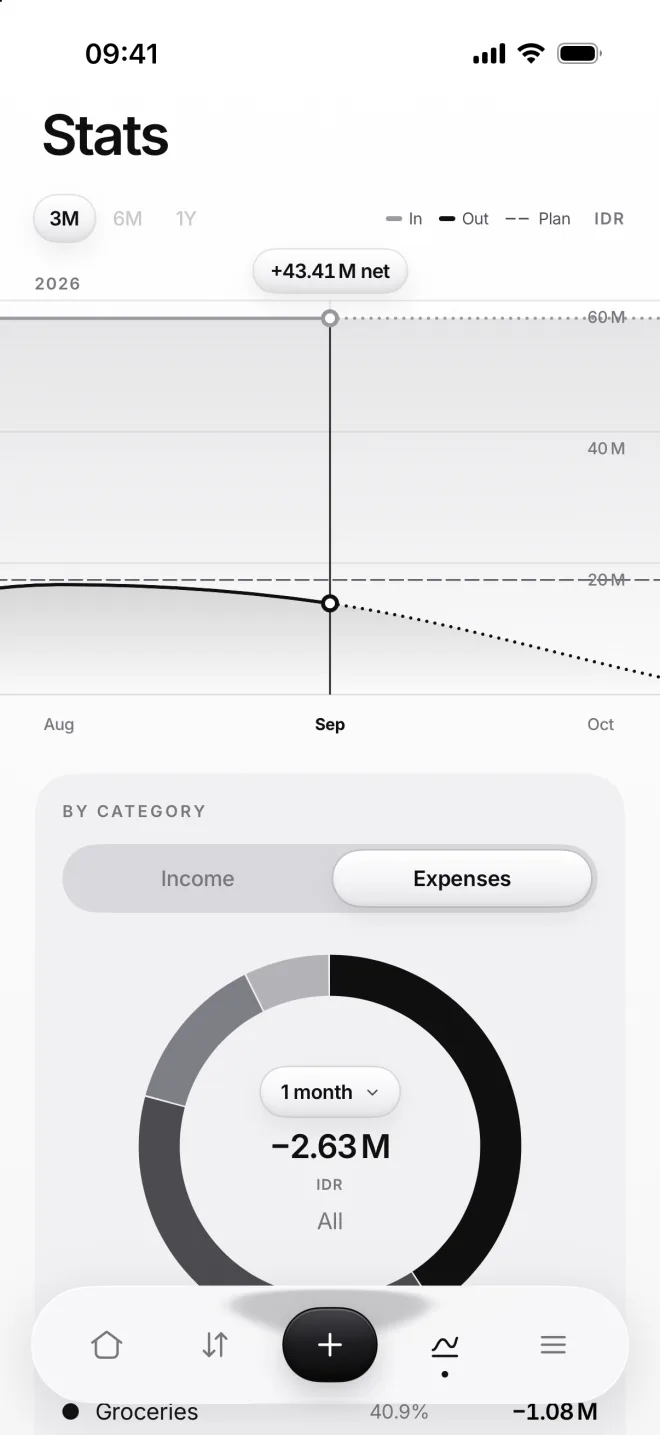
Months on a chart
Stats shows money in and out for the last three months. The dotted end is October: this month isn’t over, so it’s still growing.
Tap a month to see what was left of it: 43.41 million rupiahs in September. The dashes show your budgets, all of them together.
-
Where it went
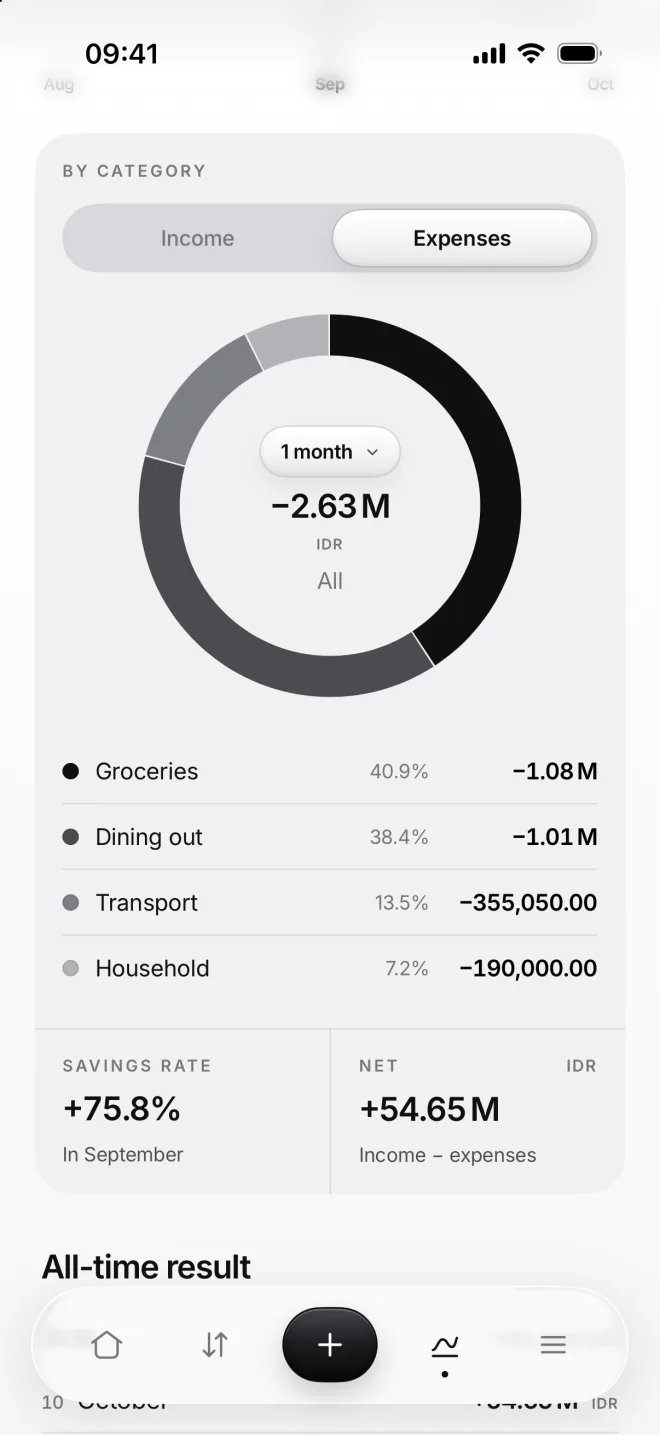
The ring splits this month’s expenses by category, Groceries first. Tap a slice to see its amount, or switch over to Income.
Under it, Savings rate is the share of income you kept in the last full month, 76% in September; Net is money in minus out.
-
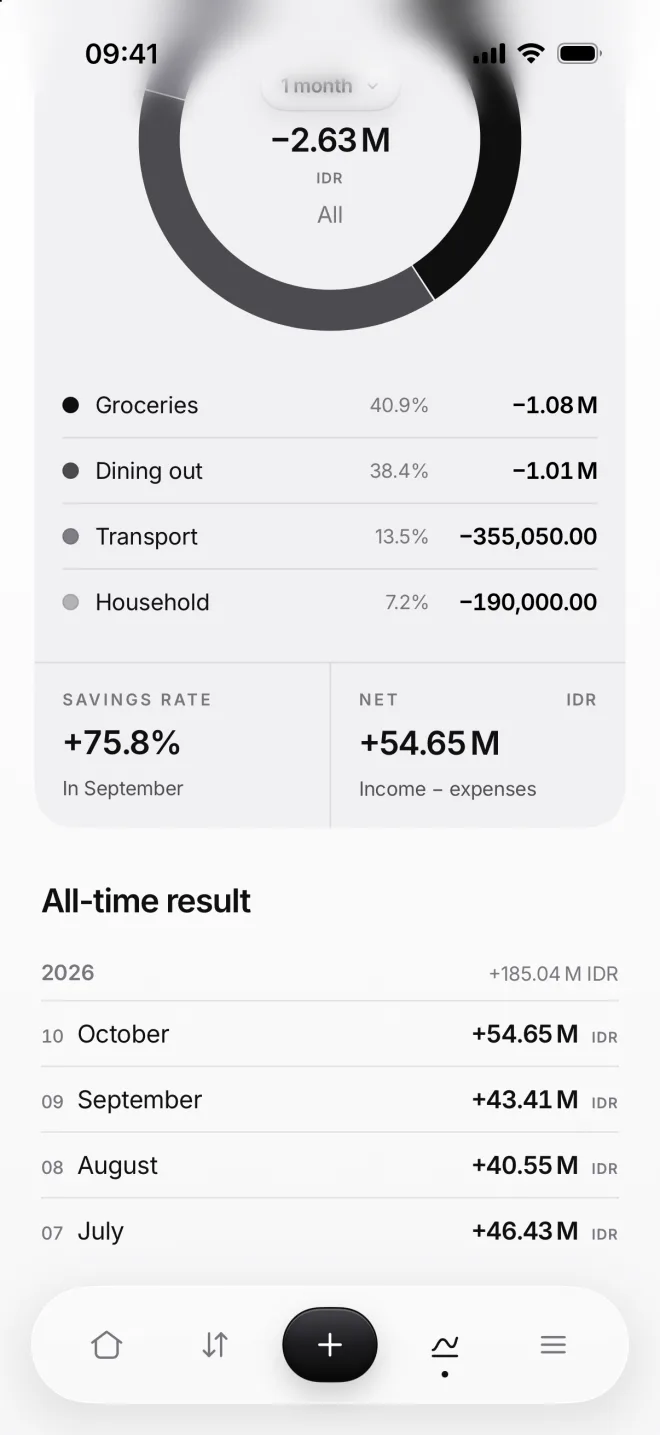
Every month’s result
All-time result lists every month with what was left of it, newest first, and the year’s total: 185.04 million rupiahs so far.
-
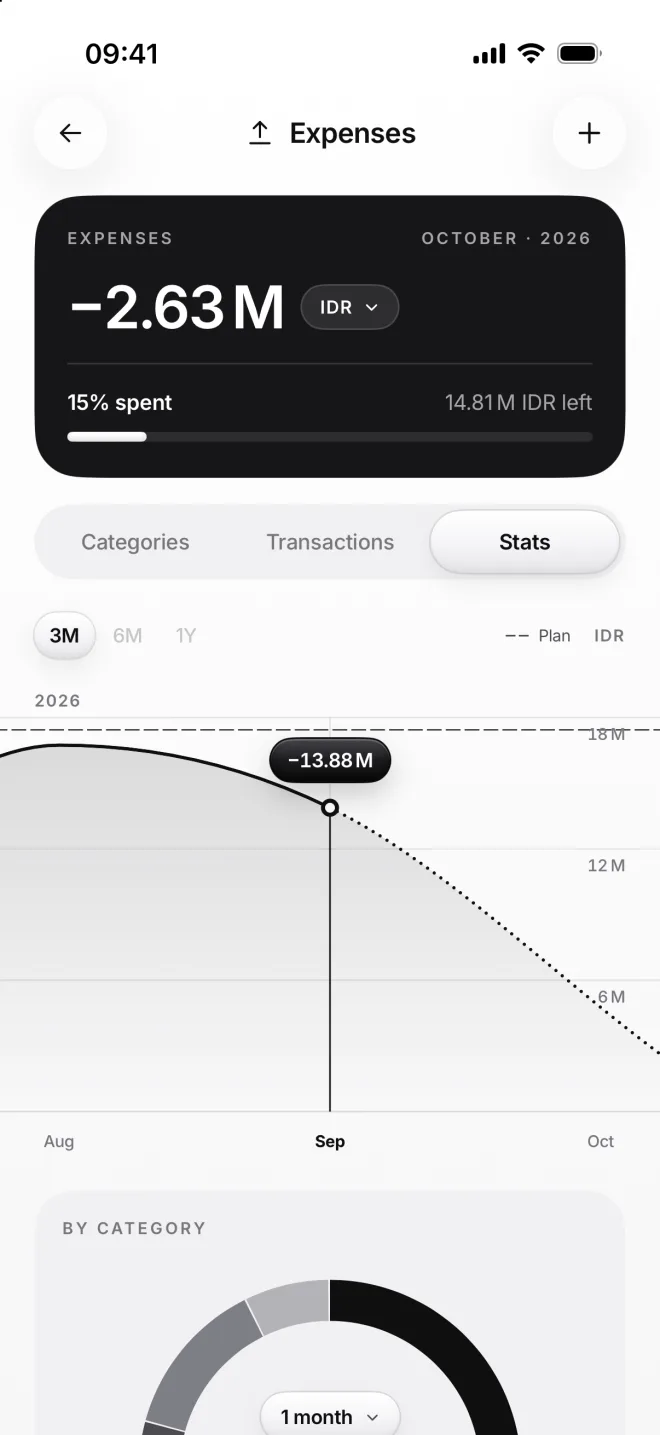
Stats of a section
Each section and category has its own Stats tab. Expenses draws its line against your budget: 13.88 million in September.